The plate scale at the loction of the slit is 0.254 arcseconds per 1000th of an inch (i.e., 10 arcseconds per millimeter). The "default" slit width of 0.01 inches corresponds to 2.54 arcseconds.
For a 2.54 arcsecond slit, the "best" focus achieved yields unresolved lines that have 2.6-2.7 pixels FWHM. Thus, we estimate the plate scale at the location of the detector to be roughly 1 arcsecond per pixel.
The wavelength coverage from a single spectrum is about 2300A. The actual range covered, of course, depends on the grating tilt. The following equations can be used to roughly estimate the wavelength coverage as a function of corrected micrometer reading... [The fine-tuning numbers on the micrometer lie in range 0 - 25. That is, one complete on the dial corresponds to 25 ticks. We correct this number to a decimal (i.e., base ten) system.]
The position of the 4764.8648 A line in the CuAr spectrum as a function of corrected micrometer reading (cmr) is: pos = 1407.56 - 232.11 x cmr.
From this position, the lower and upper wavelength limits can be roughly computed using:
lambda_low = 4764.8648 A + 1.134 A/pix (pos - 54)
lambda_upper = 4764.8648 A + 1.134 A/pix (pos - 2101)
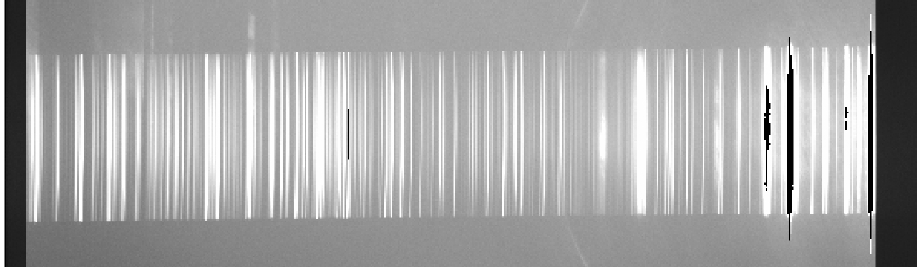
The following is a 2d spectrum of the CuAr arc lamp used for wavelength calibration. The image is a 10s shot taken with the reddest grating tilt allowable and the red blocking filter which gives spectra in the range 4375-6700 Angstroms. Note that in the image, the bluest wavelength appears on the right, while the reddest wavelenth appears on the left.
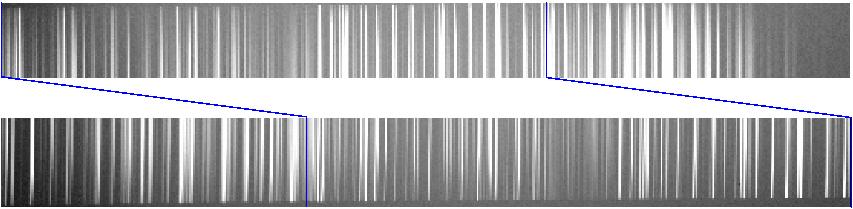
The following image is the same as above, but without the blocking filter.