This second round of investigation stemmed from concerns about observing more than just the inner, high surface brightness regions of galaxies.
--------
NGC 6946
--------
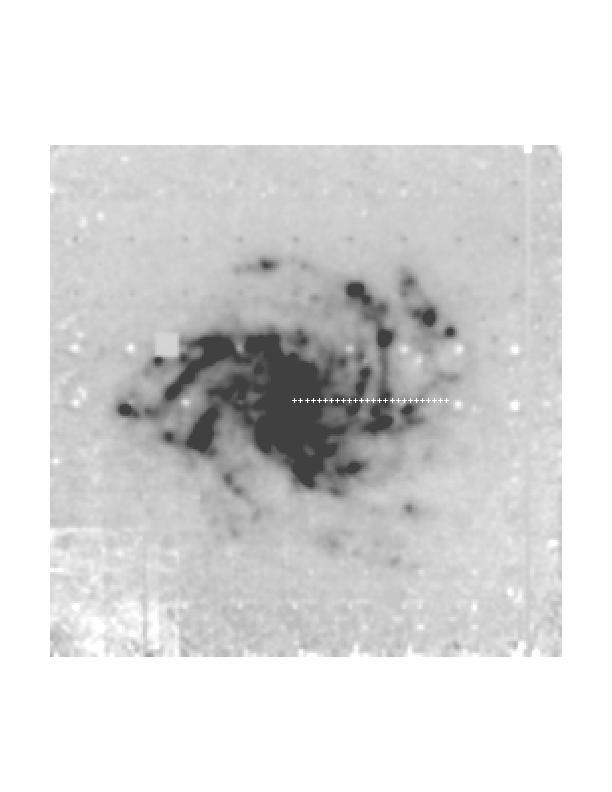
NGC 6946 serves as our test case.
The series of 9"-spaced plus symbols indicates one potential radial cut
along the major axis of NGC 6946. The symbols in this figure span
a radial distance of 225". The outermost regions of the cut show
a HI column density of ~1e21 H-atoms/cm^2 (Tacconi & Young 1986).
This is about a factor of four larger than the HI column density seen towards
high Galactic latitudes (Kulkarni & Heiles 1988).
These regions have a 15 micron surface brightness of ~1 MJy/ster. Interestingly, If we assume a radiation field comparable to that of the local ISRF and a Milky Way metallicity and cirrus mid-infrared emissivity (Boulanger & Perault 1988), the inferred atomic gas density that we are sampling is also ~1e21 H-atoms/cm^2. In other words, the outermost regions of our potential radial cut along NGC 6946 may be like cirrus regions of the Milky Way.
-----
Results
-----
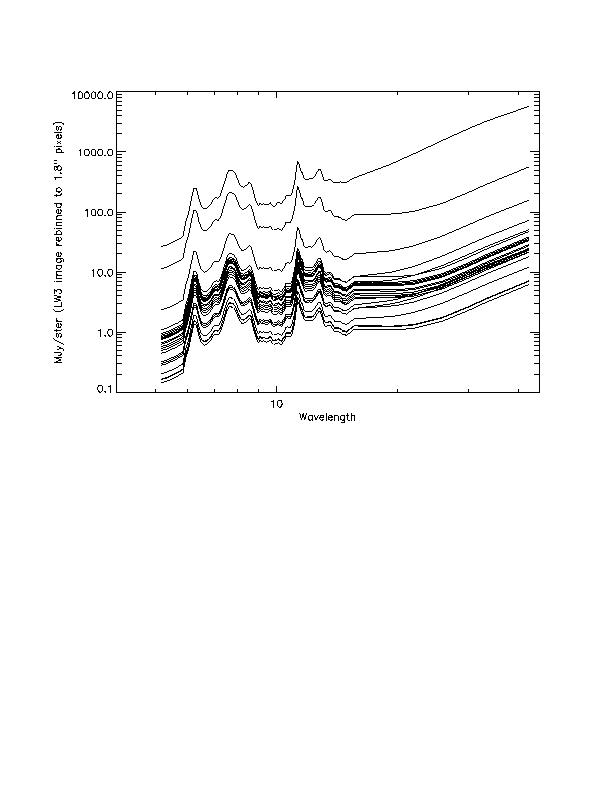
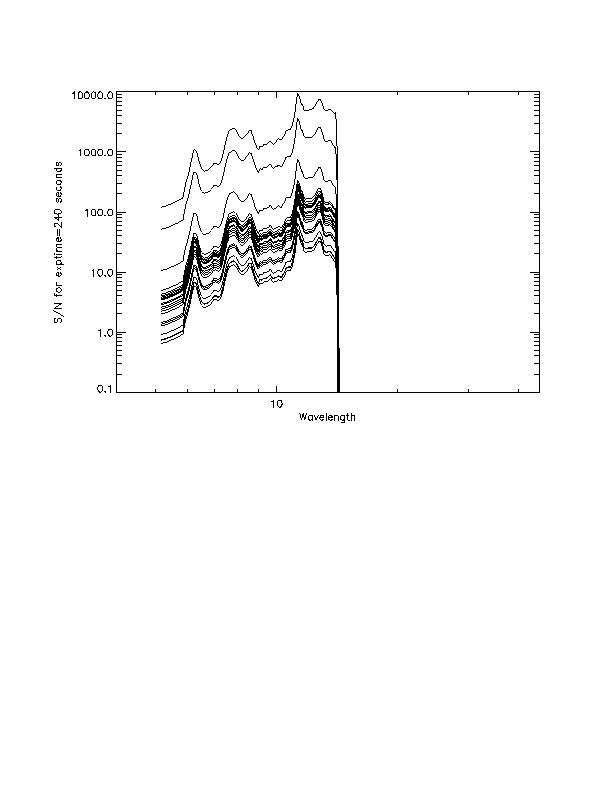
Spectra for the cut along NGC 6946
are displayed in MJy/ster. The eight brightest spectra are from the
inner 75"; the 17 weaker spectra correspond to radial distances between
75" and 225". Notice how the spectral shapes differ for the different
regions. These trends were estimated using the ISO 7/15 micron ratio
and a model for normal galaxy SEDs.
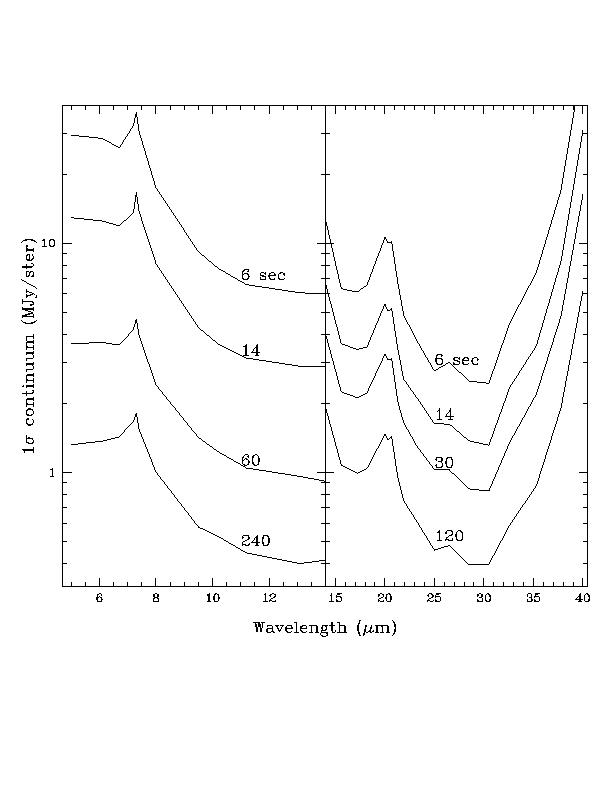
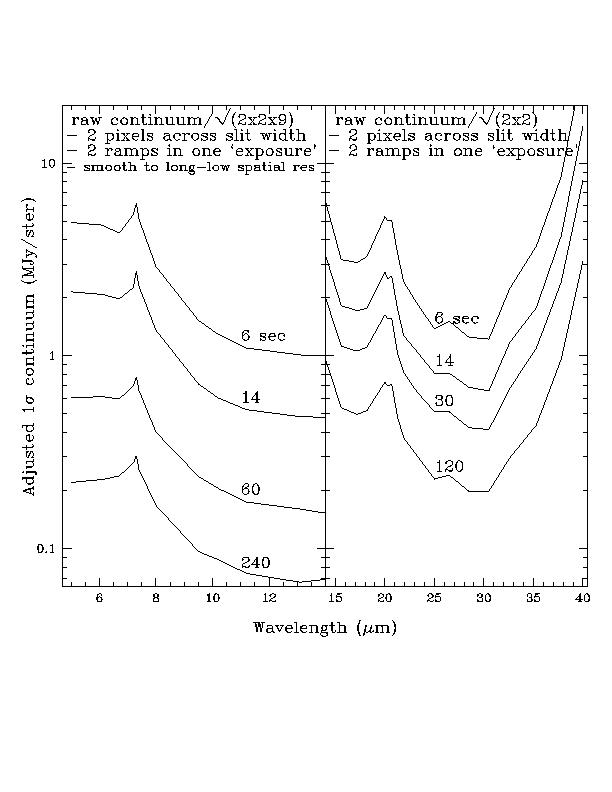
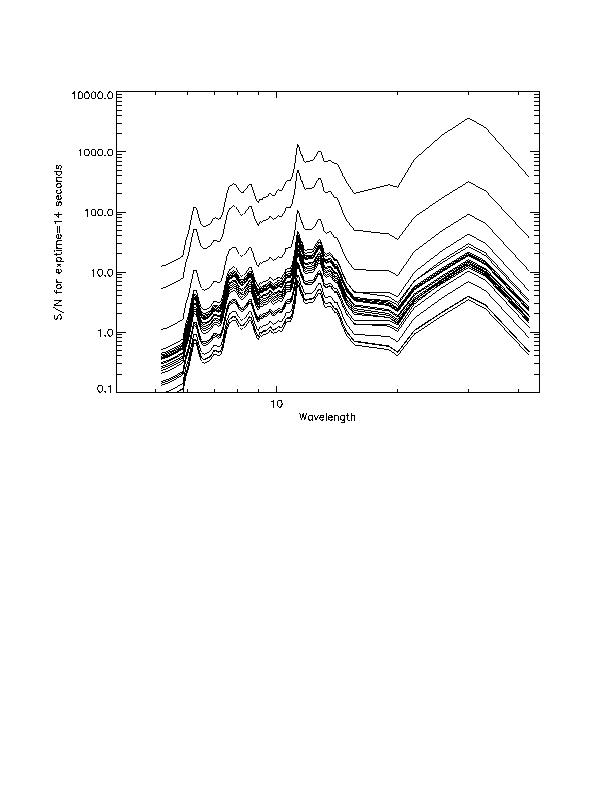
The raw surface brightness noise levels for a variety of elementary integrations are computed from quoted 1-sigma continuum levels for point source observations. More realistic noise levels are obtained after combining data from the two `ramps,' the two pixels that fill the slit width, and after smoothing the short-low data to the spatial resolution of the long-low data.
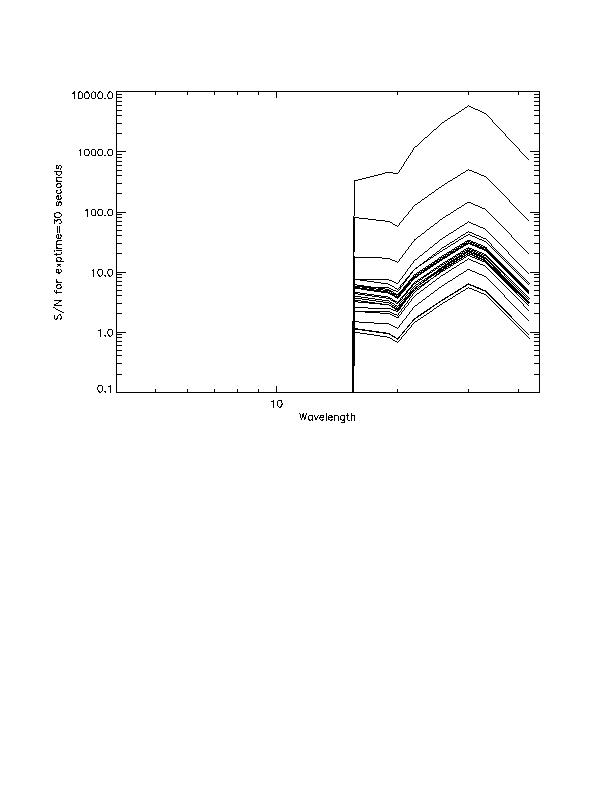
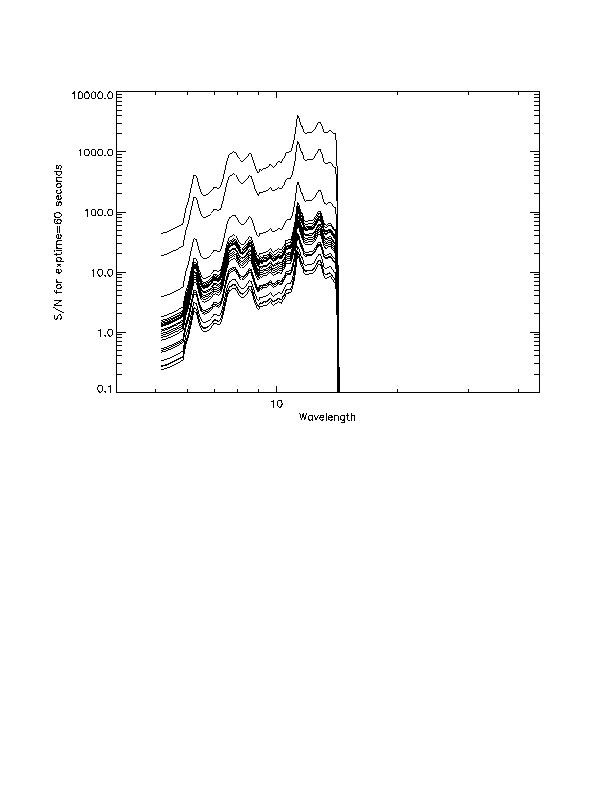
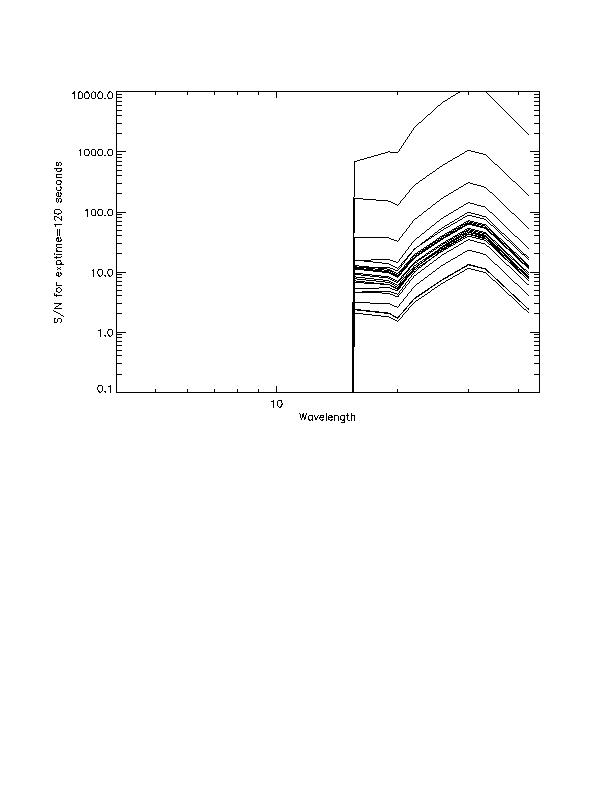
Signal-to-noise estimates show that we can recover adequate data from the central regions using a 14 second elementary (scan) integration. Longer integrations would be required to achieve reasonable S/N for lower surface brightness regions. S/N estimates are provided for 30, 60, 120, and 240 second elementary (scan) integrations.
--------
Discussion
--------
Note that the lowest S/N coverage occurs for the 5.3-7.5 micron short-low
subunit. Moreover, recall that the bulk of the `action' occurs at
longer wavelengths: (i) the clusters of PAH features near 8
microns and 12 microns are also not covered by the short-low subunit; (ii)
the steep mid-IR slopes that are typical of HII region cores are most clearly
evident beyond ~ 10 microns (e.g Cesarsky et al. 1996). In fact,
the shape of the mid-IR spectrum from 3 to 12 microns is essentially constant
from galaxy to galaxy (Helou et al. 2000) and from region to region within
galaxies (O. Laurent, private communication).
It may behoove us to focus on the 7.5 to 40 micron wavelength span, and maybe even just the 14.2 to 40 micron portion, for observations of normal galaxies. Since the 5.3 to 7.5 and 7.5 to 14.2 micron wavelength regimes are relatively `unexciting' and will be covered by the IRAC 5.8 and 8.0 micron array observations, we can argue that we need not spend valuable time observing with these subunits; we may want to only observe the nucleus, and possibly some attractive HII regions, with the 7.5 to 14.2 micron short-low subunit. This will significantly cut down IRS integrations times (see table).
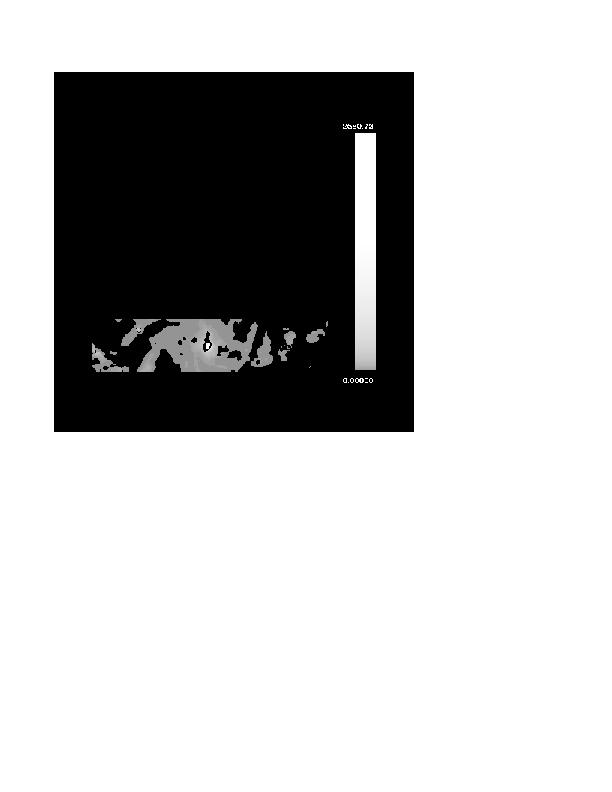
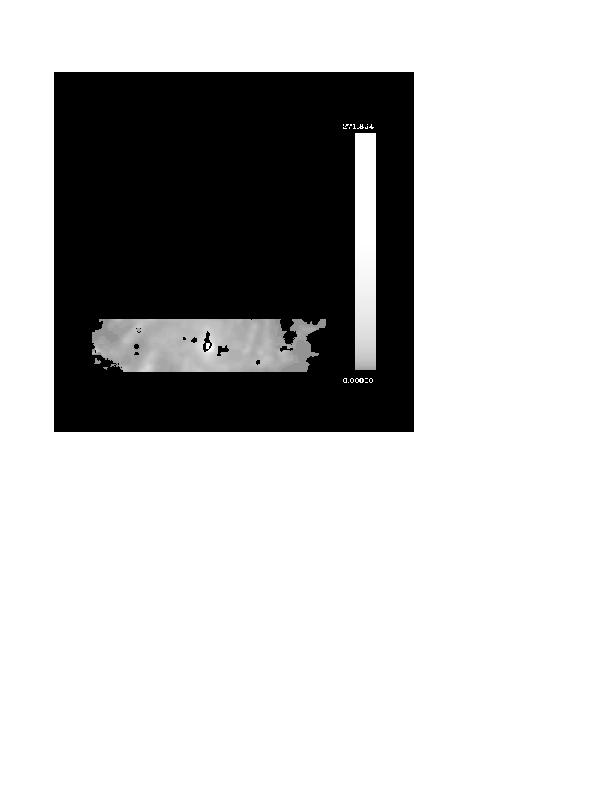
This figure outlines one possible observing
strategy to observe a 54.6"-wide strip along the disk major axis, where
54.6" is the length of the short-low subunits. By using spatial step
sizes equal to half the length of one long-low subunit (i.e. spatially
oversampling by a factor of two) we can minimize the effects of bad pixels.
In addition, we can boost the S/N if these data are co-added. Each
pair of rectangles/squares represents the area covered by one scanning
observation. The rectangular pairs outline the 151.3"x54.6" areas
we may cover with the long-low subunits, whereas the 54.6"x54.6" square
areas show possible short-low target fields; because short-low integrations
are relatively expensive, we could select in advance a few regions in the
strip on which to focus at these wavelengths.
(30 micron image)(8.26 micron image)
-------
Summary
-------
The following tables show the integration times necessary to map a
N"x54.6" major axis region from 14.2 to 40 microns (partial maps of satellite
fields will come for free), and the time required for doing 54.6"x54.6"
regions from 7.5 to 14.2 microns. Of course we need not restrict
ourselves to 54.6" scan widths.
Table 1: Single Scan Data
Exptime Scan rate Scan Width Scan Integration
(sec) (arcsec/sec) (arcsec)
(minutes)
Short-low 6
0.13846 54.6
6.57
14 0.08571
10.62
60 0.02432
37.42
240 0.00608
149.67
Long -low 6
0.37308 54.6
2.44
14 0.23095
3.94
30 0.13108
6.94
120 0.03277
27.77
Overheads: slew time=180 sec
peak-up time=210 sec
command execution~22 sec
slew time for each step=16 sec
Table 2: Integration times (Including above overheads)
Exptime 0.55' 0.91' 1.8'
3.1' 4.3' 5.6' 6.8' 8.1'
9.4' 10.6' <-- e.g. galaxy major axis diameter
(sec) (------------------minutes--------------)
Short-low 14
17.5
Appropriate for bright nuclear regions
Short-low 60
44.3
Appropriate for regions down to fnu(15 mu)~5 MJy/st
Short-low 240
156.5
Appropriate for regions down to fnu(15 mu)~1 MJy/st
Long-low 14
23.4
27.6 31.8 36.0 40.3 44.5 48.7
52.9 57.1
Long-low 30
35.4
42.6 49.8 57.0 64.3 71.5 78.7
85.9 93.1
Total Low-Res Integration Estimate - NGC 6946
The total integration time for the example observing strategy outlined
above for NGC 6946 (1 MJy/st diameter ~ 6.2'), if we use Exptime=30 sec
for long-low and shoot for 3 fields with the short-low 7.5-14.2 micron
subunit, would be 39.3 + 71.5 = 111 minutes.
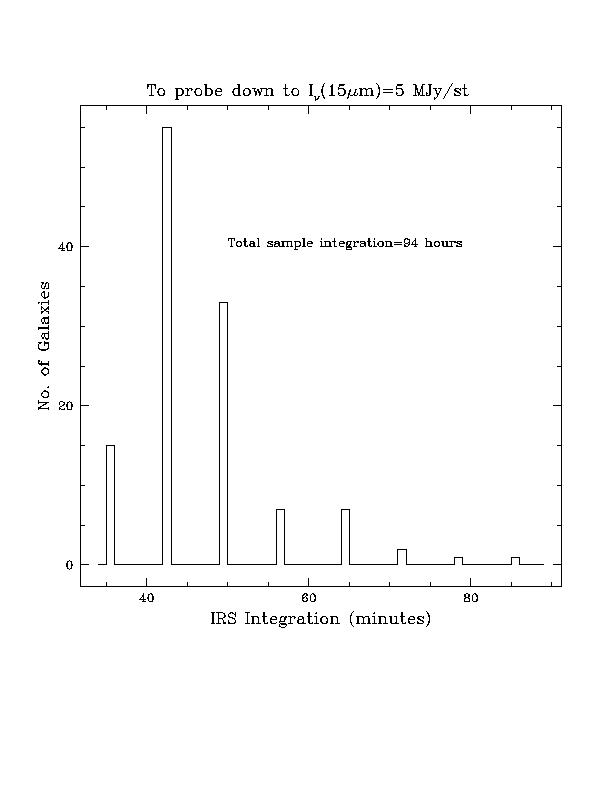
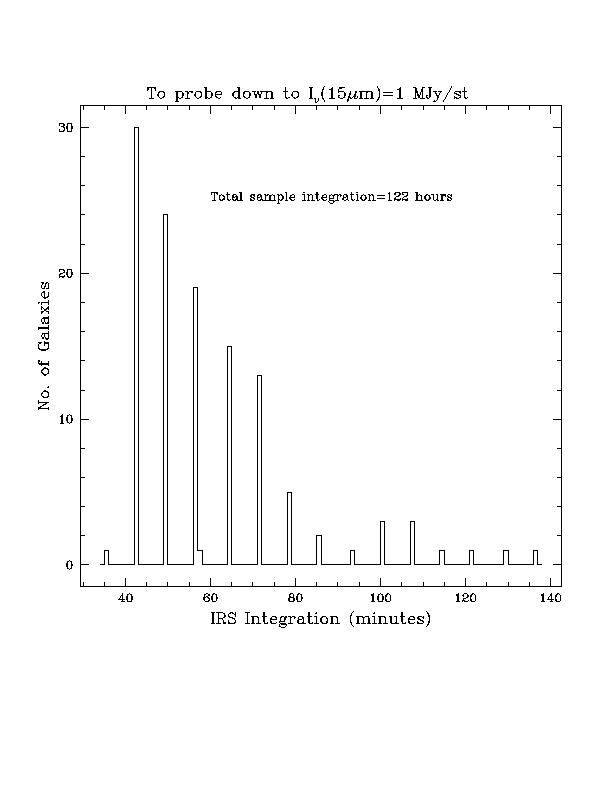
Total Long-Low-Res Integration Estimate - Legacy sample of 121 galaxies
Probing down to fnu(15 mu)~5 MJy/st
Probing down to fnu(15 mu)~1 MJy/st
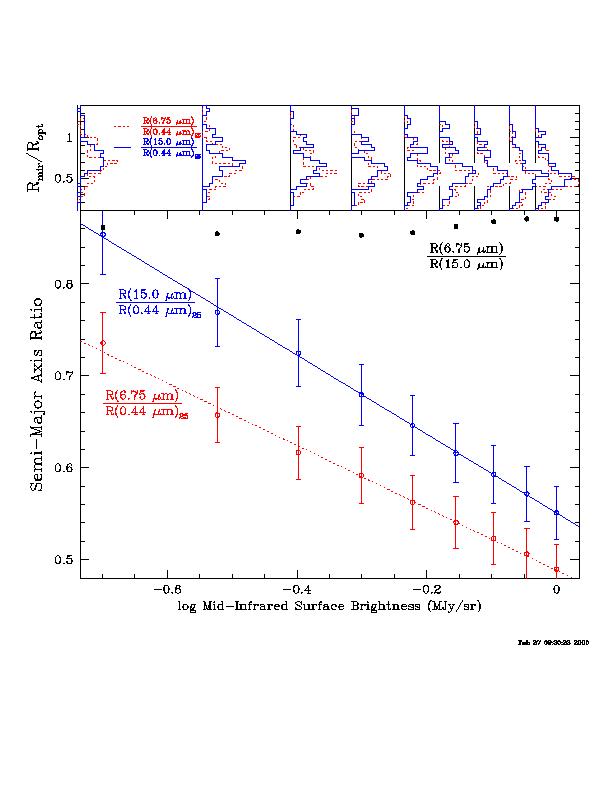
(The above use the empirical R_mir/R_opt
trends observed for the ISO Key Project sample.
Click here for a summary of MIPS SED mode observations for NGC 6946
Danny Dale
12 June 2000