In the PV diagram, lines of constant temprature (isotherms) run
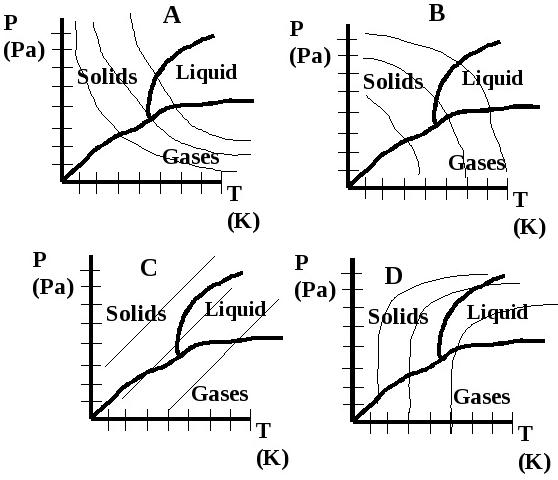
from upper left to lower right because P is inversely proportional to V: P = T/V. Consider the following Pressure-Temperature (P-T or phase diagram )
graphs. Which one correctly represents lines of constant volume?
