Further details on these device can be found at http://ssc.spitzer.caltech.edu/obs/. These regions were all extracted at different orientations and with different apertures. All spitzer data was taken from SH extraction sizes unless otherwise specified. They regions inspected visually on top of 8 micron images taken by Spitzer's IRAC camera. Additionally, to account of discrepancies in the apertures, Cliff Johnson made corrections to the line fluxes which are included in the plots.
NGC 0628
NGC 0925
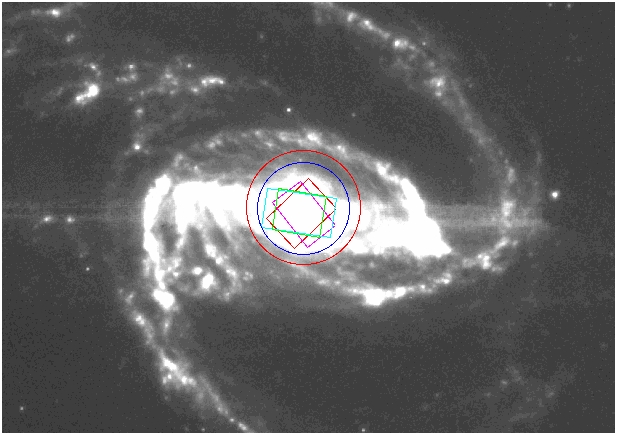
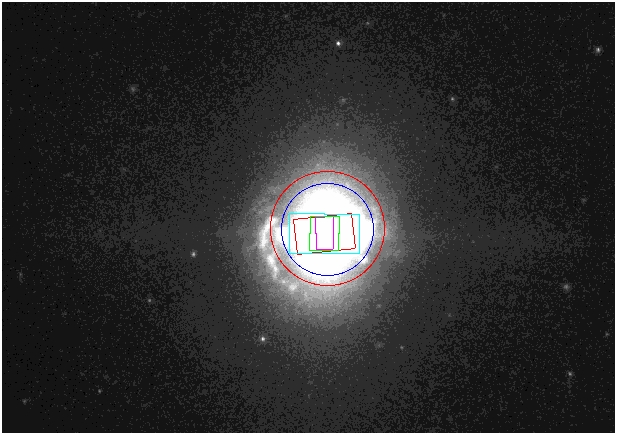
NGC 1097
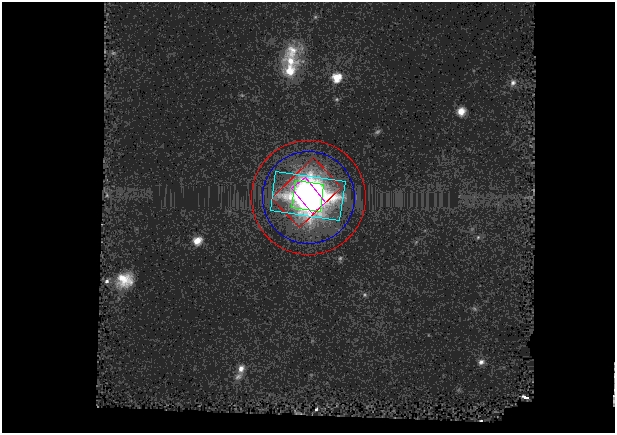
NGC 1266
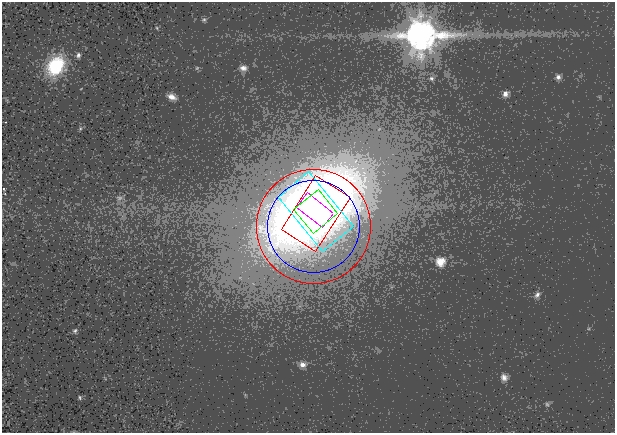
NGC 1316
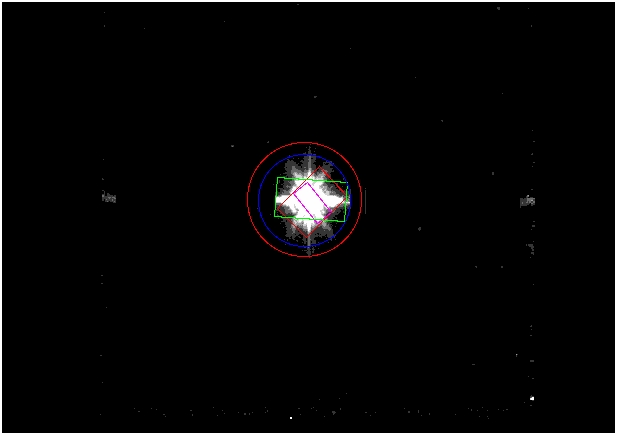
NGC 1377
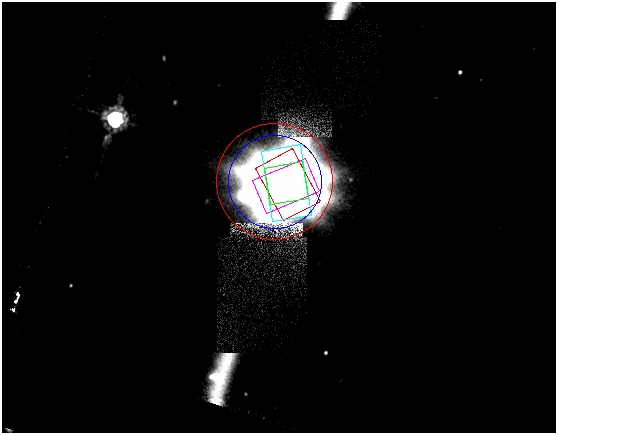
NGC 1482
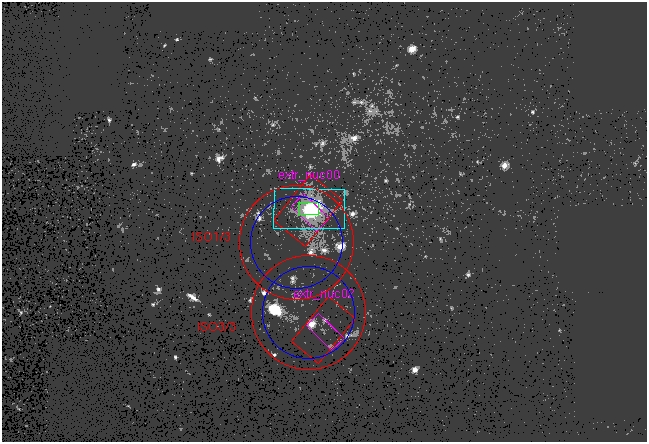
Holmberg II
NGC 3031
NGC 4125
NGC 4236

NGC 4450

NGC 4559

NGC 4569

NGC 4579

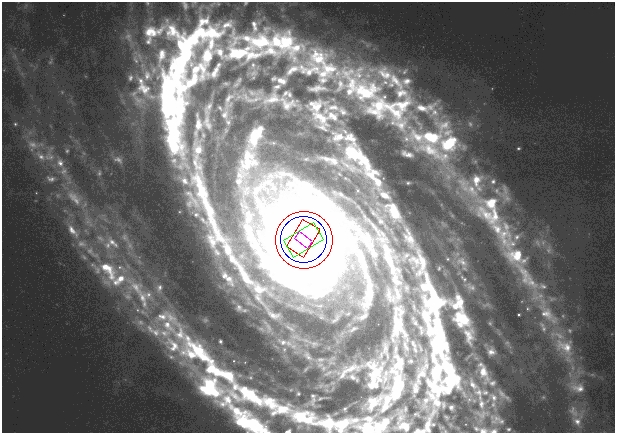
NGC 5194

NGC 5195

NGC 5713

NGC 5866

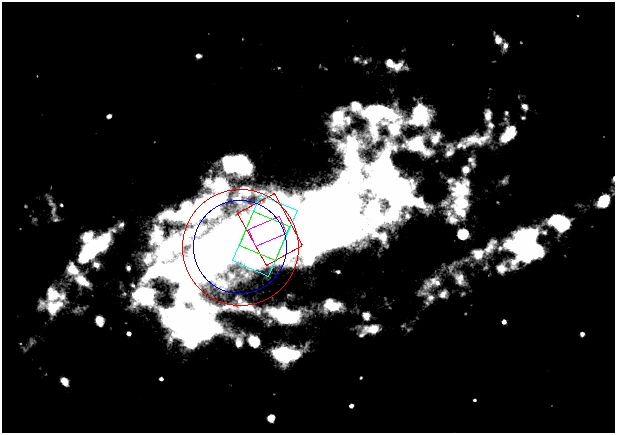
NGC 6822
(Only Exatra-nuclear region 00 used)

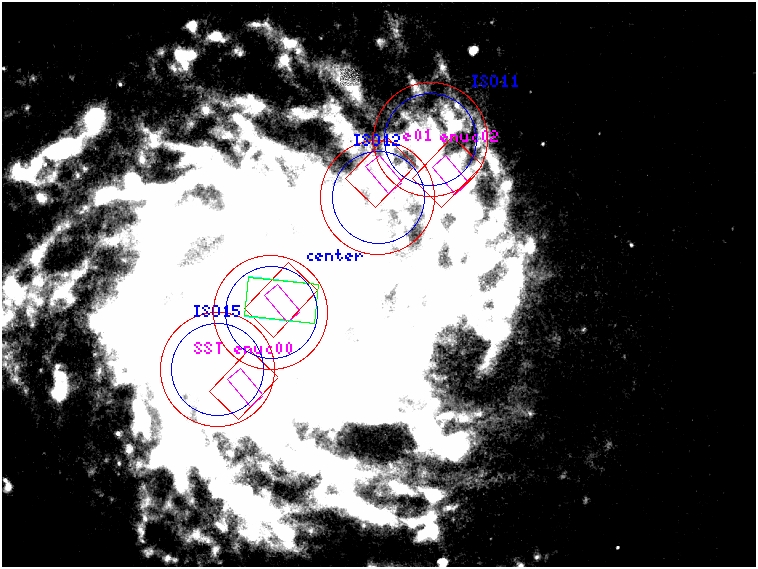
NGC 6946

NGC 7331

NGC 7552

NGC 7793
