|
1
|
- Today: Chapter 8, Properties of Stars
|
|
2
|
- How much energy do stars produce?
- How large are stars?
- How massive are stars?
- We will find a large range in properties!
|
|
3
|
|
|
4
|
- Apparent Brightness: How
bright star appears to us
- Intrinsic Brightness:
“Inherent” – corrected for distance
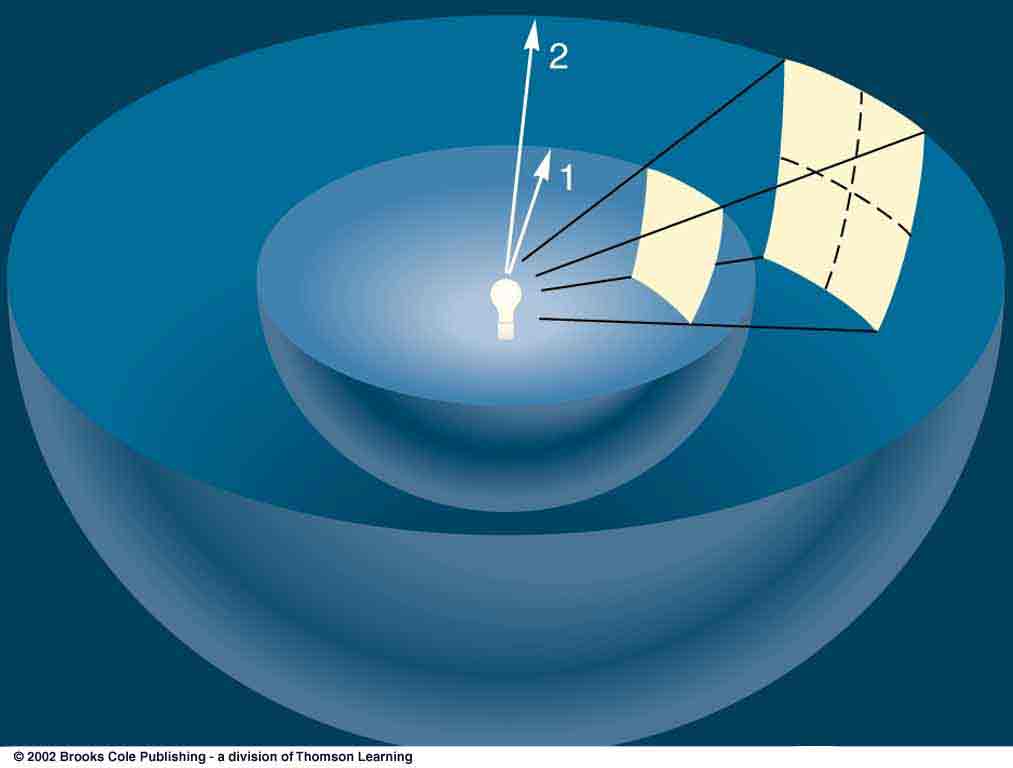
- How does brightness change with distance?
- Flux = energy per unit time per unit area: joule/sec/m2 = watts/m2
- Example: 100 watt light
bulb (assume this is 100 W of light energy)
spread
over 5 m2 desk gives
20 Watts/m2
- Sun’s flux at the Earth
- Luminosity = 3.8 ´1026 Watts
- It has spread out over sphere of radius 1 AU = 1.5 ´ 1011 m
- Surface area of sphere = 4 p R2 = 2.8 ´1023 m2
- FSun = 3.8 ´1026 Watts / 2.8´1023
m2 = 1,357 W/m2
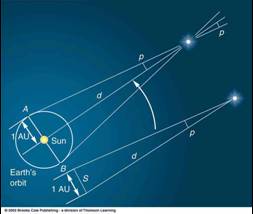
- Inverse Square Law:
Flux falls of as 1/distance2
|
|
5
|
|
|
6
|
- To correct intensity or flux for distance, use Inverse Square Law
- Up to now we have used “apparent magnitudes” mv
- Define absolute magnitude Mv as magnitude star would
have
if it were at a
distance of 10 pc.
- This gives us a way to correct Magnitude for distance, or find distance
if we know absolute magnitude. Note: the book writes mv and
Mv: The
“V” stands for “Visual” -- Later we’ll
consider magnitudes in other colors like “B=Blue”
“U=Ultraviolet”
|
|
7
|
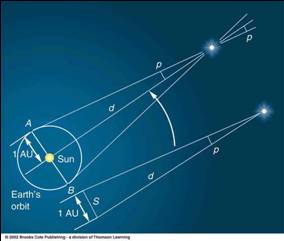
- Problem from textbook:
- mV MV d (pc) P (arcsec)
- ___ 7 10 _______
- 11 ___ 1000 _______
- ___ -2 ____ 0.025
- 4 ___ ____ 0.040
|
|
8
|
- Problem #4:
- m MV d (pc) P (arcsec)
- 7 7 10 0.1
- 11 1 1000 0.001
- 1 -2 40 0.025
- 4 2 25 0.040
|
|
9
|
- What patterns matter for people – and how do we recognize them?
- Weight and Height are easy to measure
- Knowing how they are related gives insight into health
- A given weight tends to go
with a given height
- Weight either very high or very low compared to trend ARE important
- Plot weight vs. height and look for deviations from simple line
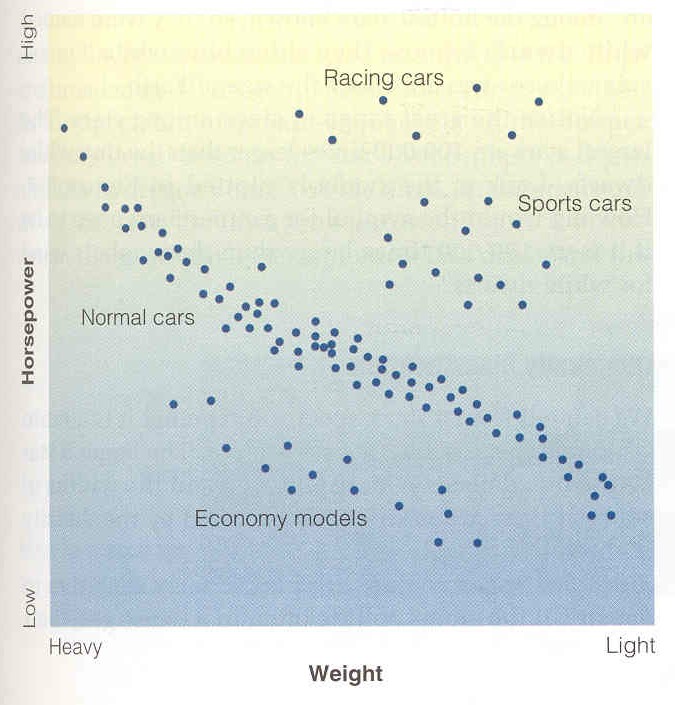
- Example of cars from the book
- Note “main sequence” of cars
- Weight plotted backwards
- Just make main sequence a line
which goes down rather than up
- Points off main sequence are
“unusual” cars
|
|
10
|
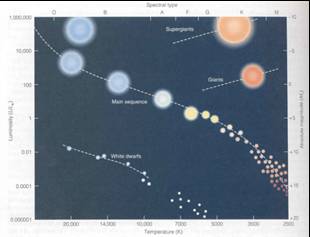
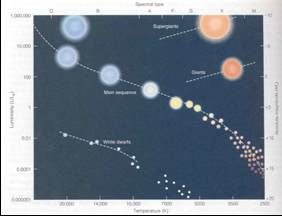
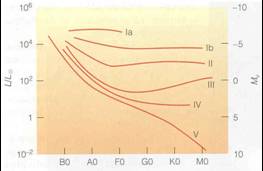
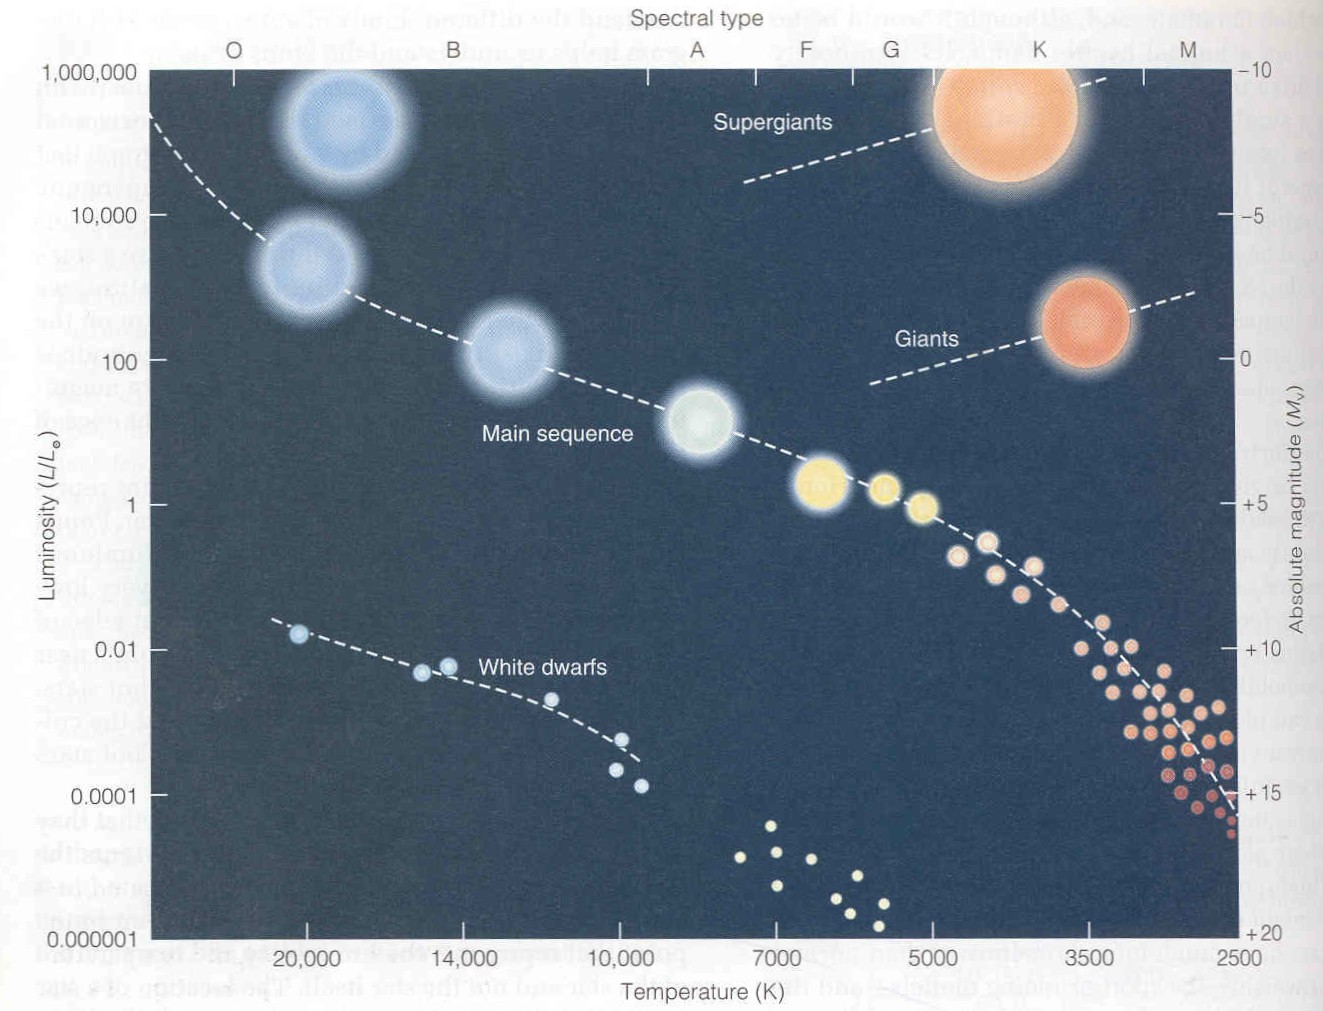
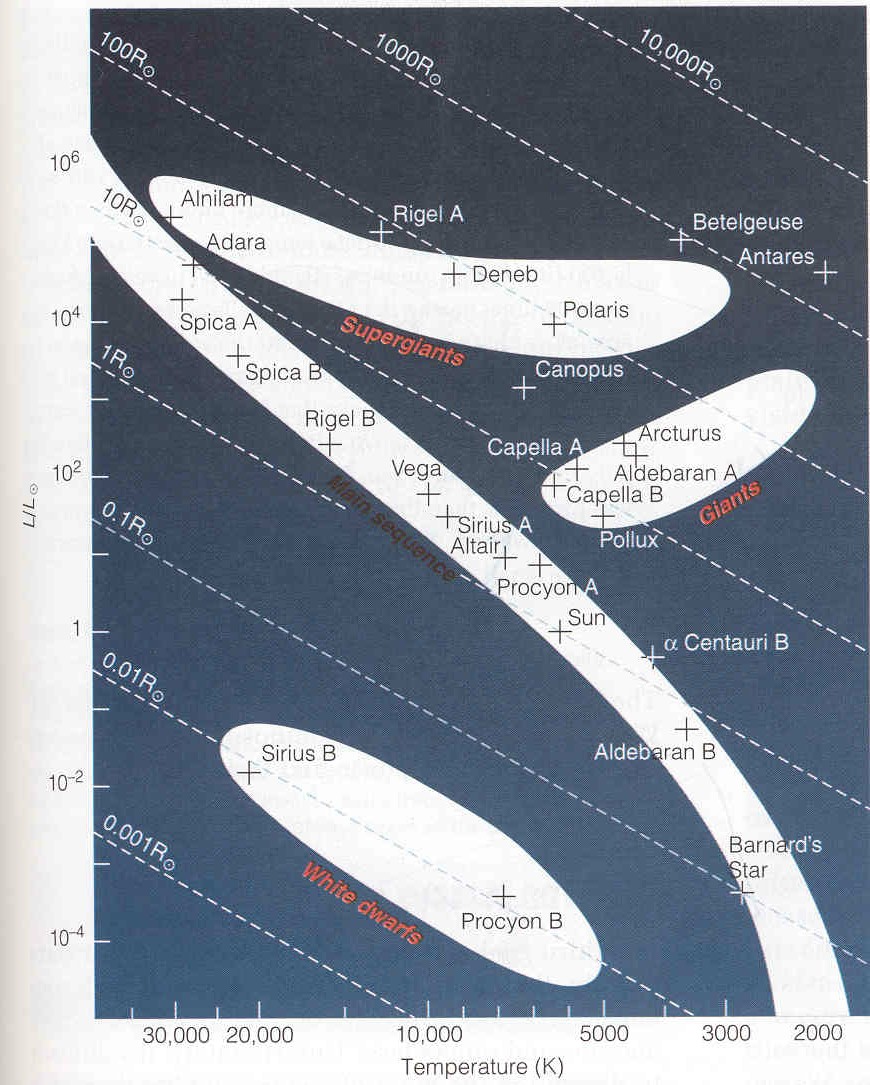
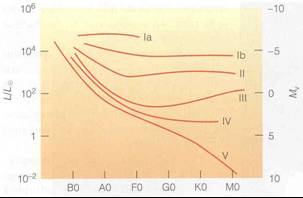
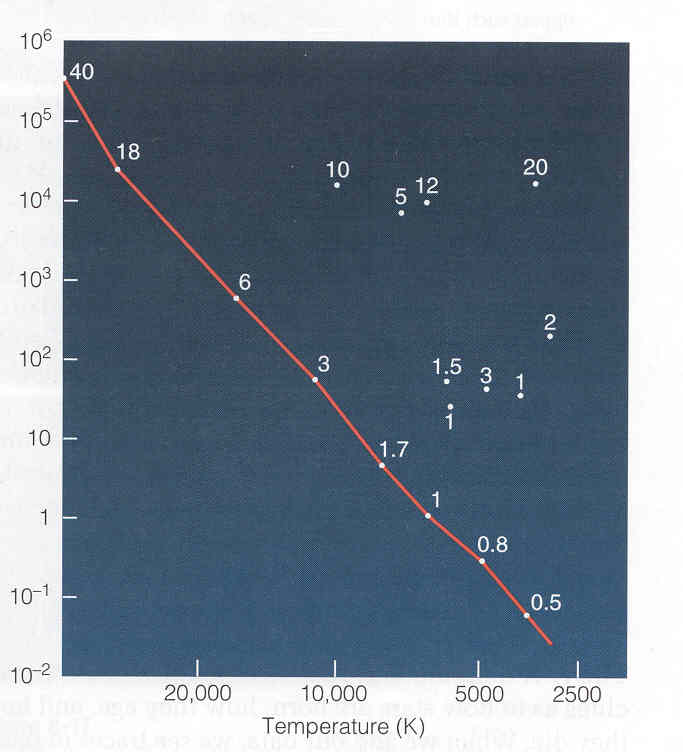
- The Hertzsprung-Russsell (H-R) diagram
- Plot L vs. backwards T. (We can
find R given L and T)
|
|
11
|
- L = area ´sT4
= 4 p R2
sT4
- Stars can be intrinsically bright because of either large R or large T
- Use ratio equations to simplify above equation
- (Note book’s symbol for Sun is circle with dot inside)
- Example: Assume T is
different but size is same
- A star is ~ 2 ´ as hot as sun, expect L is 24 = 16
times as bright
- M star is ~1/2 as hot as sun, expect L is 2-4 = 1/16 as
bright
- B star is ~ 4 ´ as hot as sun,
expect L is 44 = 256 times as bright
- Example: Assume T same but
size is different
- If a G star 4 ´ as large as sun, expect L would be 42=16
times as bright
|
|
12
|
- L = 4 p R2
sT4
- The main sequence consists very roughly of similar size stars
- The giants, supergiants, and white dwarfs are much larger or smaller
|
|
13
|
|
|
14
|
|
|
15
|
|
|
16
|
|
|
17
|
|
|
18
|
|
|
19
|
|
|
20
|
|
|
21
|
|
|
22
|
|
|
23
|
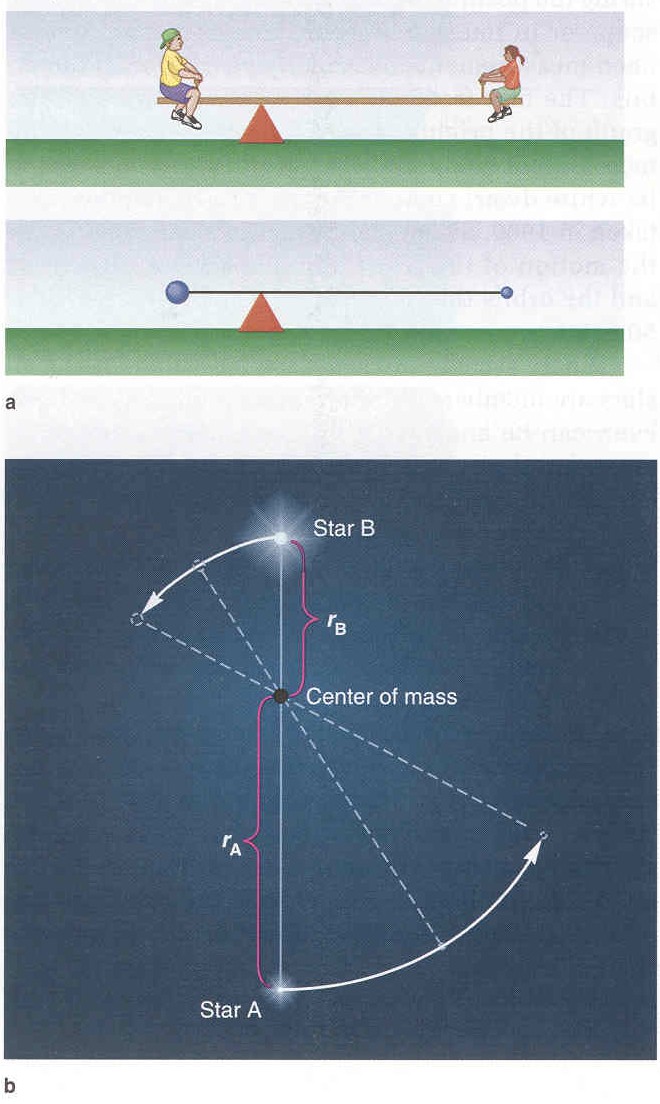
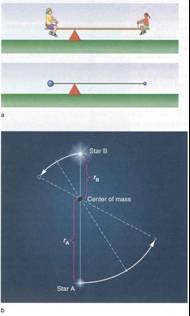
- Two types of binary stars
- Visual binaries: See separate stars
- a large, P long
- Can’t directly measure component of a along line of sight
- Spectroscopic binaries: See
Doppler shifts in spectra
- a small, P short
- Can’t directly measure component of a in plane of sky
- If star is visual and spectroscopic binary get get full set of
information and then get M
|
|
24
|
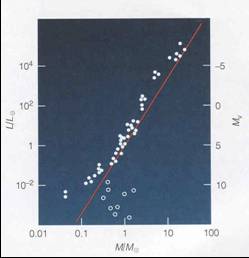
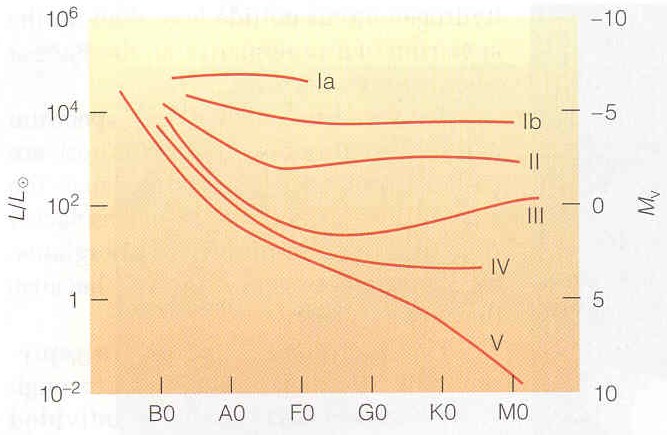
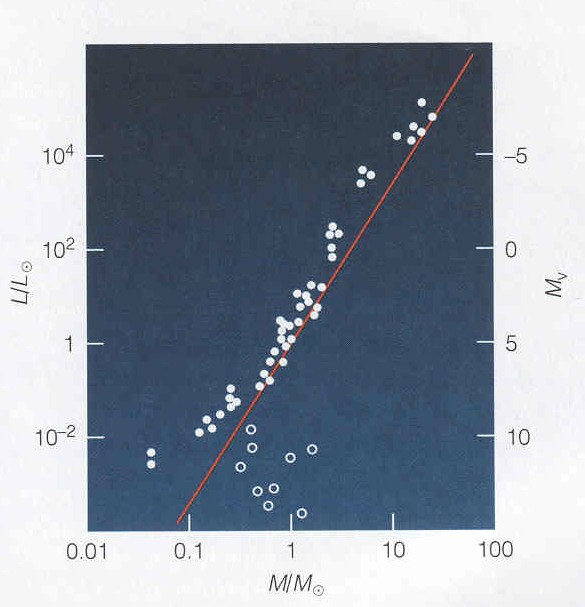
- Main Sequence position:
- M: 0.5 MSun
- G:
1 MSun
- B:
40 Msun
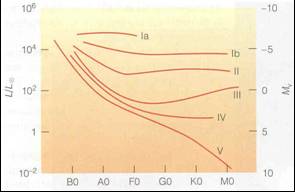
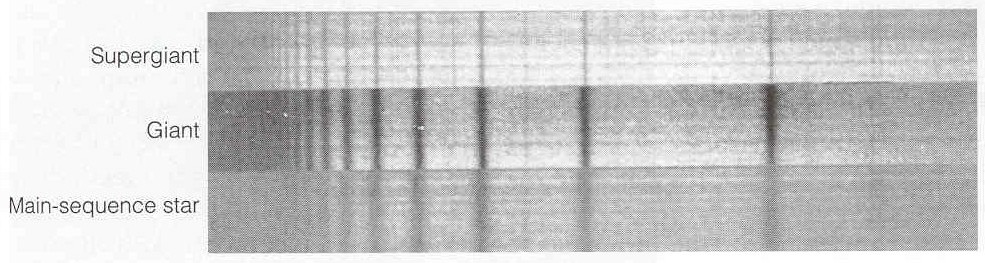
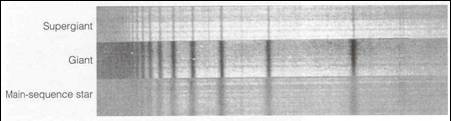
- Luminosity Class
- Must be controlled by something else
|
|
25
|
|
|
26
|
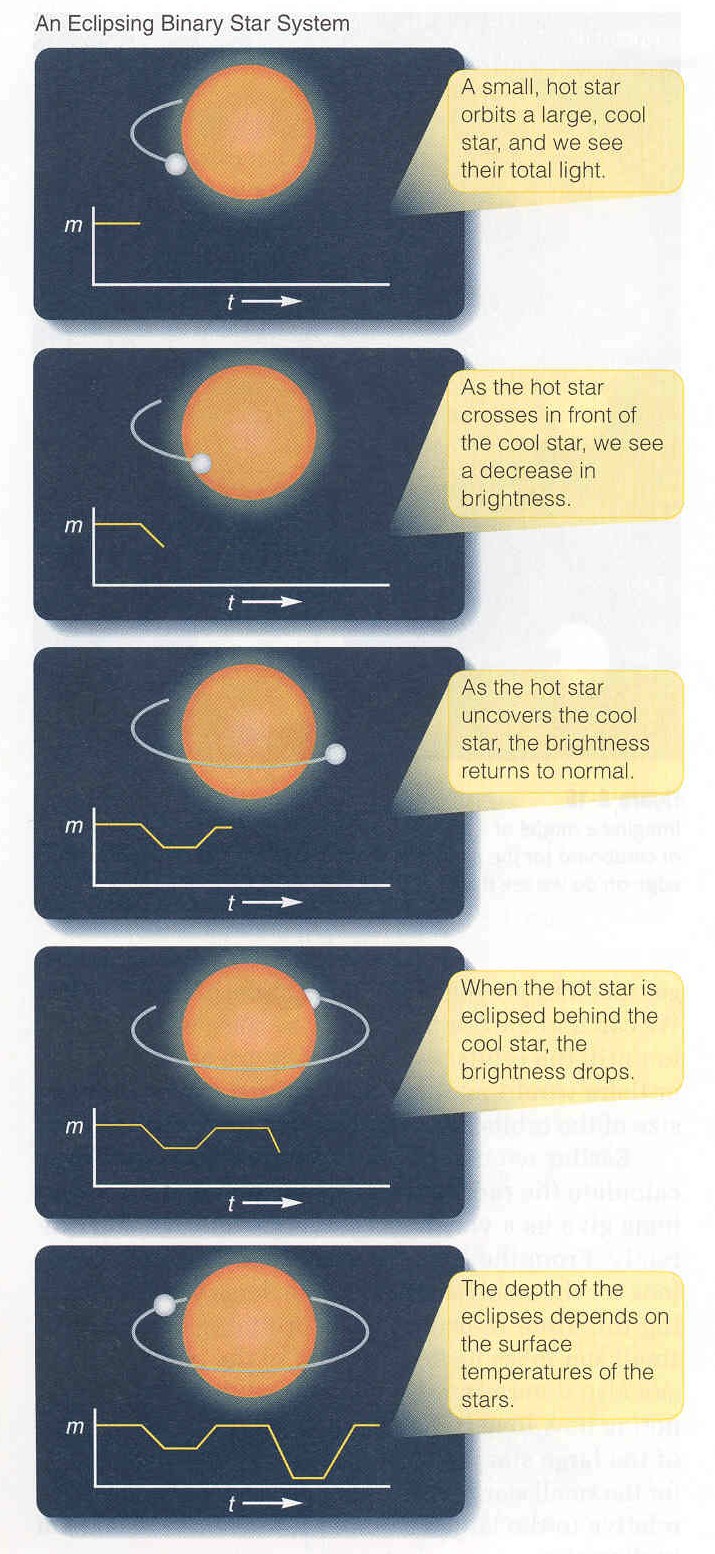
- System seen “edge-on”
- Stars pass in front of each other
- Brightness drops when either is hidden
- Used to measure:
- size of stars (relative to orbit)
- relative “surface brightness”
- area hidden is same for both eclipses
- drop bigger when hotter star hidden
- tells us system is edge on
- useful for spectroscopic binaries
|

 Notes
Notes