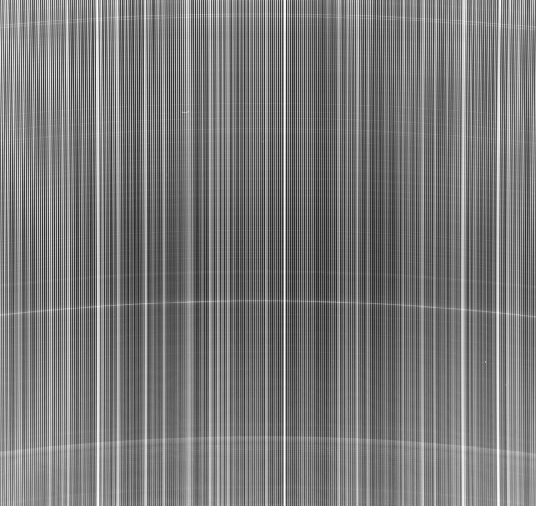
Most of the engineering tests for WIRO-Spec are complete and a few sample spectra are shown below. The images below show the spectra of the Moon (left side) and the Eskimo planetary nebula NGC 2392 (right side). Both exposures are centered on H-alpha. The individual traces from each fiber run from top to bottom with the blue end of the spectrum at the top. Thus any particular strong spectral feature can be seen running from left to right within each spectral trace. The slight curvature of the spectral lines results from optical distortion within the spectrograph and can be removed during the analysis by using spectra of comparison lamps.
A 10-second exposure of the Moon's spectrum (i.e. the Sun's spectrum) extending from the Na-I doublet at 5890 A visible near the top of the image, through H-alpha near the middle and the atmospheric "B-band" near the bottom. Numerous Iron lines can also seen.
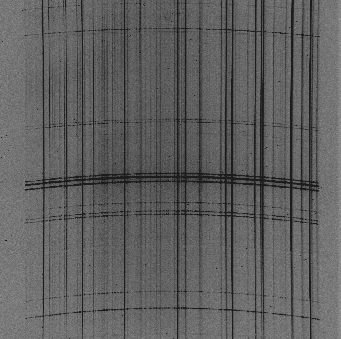
A 900-second exposure of the Eskimo nebula. The spectra are dominated by the [NII] and H-alpha lines seen in the lower center. However, numerous other emission lines are seen as well, including those from the [SII] doublet toward the bottom, [OI] (just up from H-alpha), and HeI. Some of the traces show the continuous spectrum of the hot central star.
Short (10-15 sec) exposures of spectrophotometric standard stars in the vacinity of H-alpha. Note the strong H-alpha line in Chi^2-Ceti and the detailed structure in the atmospheric "B-band". Note also the interstellar Na-D doublet seen in the spectrum of Epsilon-Ori near the He-I line.
Stay tuned for more examples!
Last Modified 12/10/2002 by Michael Pierce (mpierce@uwyo.edu)