Quasar Music
This page is under heavy construction, but will detail an innovative way to share quasar spectra with students and the public soon.
The idea is to turn quasar spectra into music, using data sonification.
The project is still in its infancy, but below are two examples of turning broad absoprtion line quasar spectra (taken with the VLT; DiPompeo et al. 2013) into sounds. Click play on the videos to hear the sound created from the spectrum being shown. These are just simple examples — there is much more to be done!
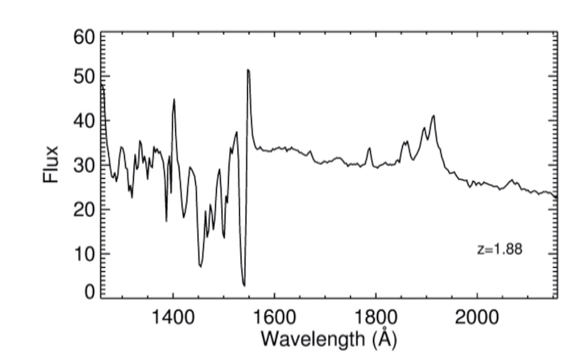
Quasar at z=1.88
The first example is a BAL quasar at redshift 1.88. The original spectrum has been smoothed (fluxes are averaged in 7 Angstrom wavelength bins), and each averaged flux measurement is represented by a single piano note. Can you identify where the various emission/absorption features visible in the spectrum occur in the music?
Quasar at z=2.43
This is another BAL quasar, but at a higher redshift (z=2.43). Thus, all of the lines are shifted farther to the red, or longer wavelenghts. This spectrum has been smoothed as well. Additionally, the data is further binned when played, so that they are played as chords (limited to a major key) and not as single notes. It also has some other synthesized effects added to it.