NIIS Laboratory Performance
NIIS has now completed laboratory performance testing at the University of Wyoming. This has involved several cool-down cycles during which the optics have remained in alignment. The only noteworthy events were the cracking of two of the filters. These were originally designed with multiple glass substrates glued together and it appears that the differing CTEs were sufficiently large to crack the filters. Replacements made with a single substrate have survived 4 cool-down cycles without damage.
The NIIS electronics allow a correlated, double-sampled (CDS) read of in 0.65
sec. through the 32 outputs of the Hawaii-2 array. At present this is the only
readout mode available but plans are underway to implement a user-selectable
number of Fowler samples in the future. The readout is also currently limited
to only a single gain of 1.15 e-/ADU resulting in saturation of the 16-bit at
65534 ADU, well-below the 200k e- level where the detector would saturate.
The detector has been measured to be linear to better than 0.5% over this
range (0 - 65534). The read noise is 23 e- in a single CDS read. It has good
cosmetics with only a few clusters of bad and/or hot pixels. A portion of a
NIIS bias frame is shown below.
The optical performance of NIIS was tested using the output of a 100-um
diameter optical fiber projected into the dewar at the primary focal plane
from the telescope. The fiber had a measured full-width at half-maximum (FWHM)
of 2.2 pixels on the Hawaii-2 detector over the full field of NIIS. This
corresponds to 0.86 arcsec at APO. The images below show a test image of the
WIRO logo and an image of the optical fiber and its mount. Also shown is the
corresponding radial profile of the fiber image showing the sharp radial
profile of the fiber.
All the available data suggests that NIIS is ready for commissioning at APO in
early 2012.
Portion of NIIS Bias Frame:
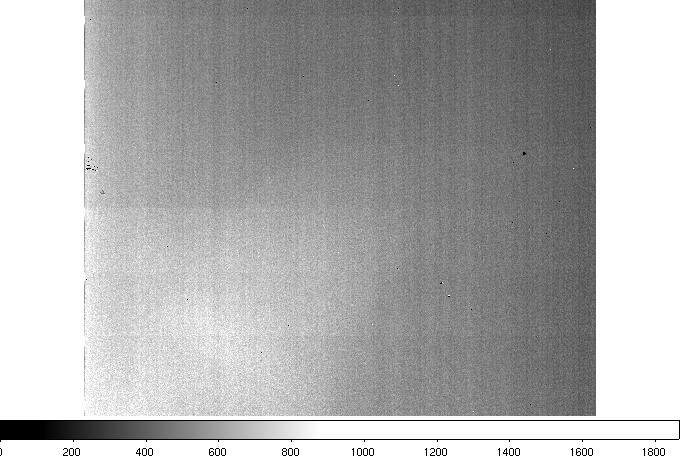 A portion of a NIIS bias frame enlarged to show the small number of clusters of
bad pixels.
A portion of a NIIS bias frame enlarged to show the small number of clusters of
bad pixels.
Portion of NIIS Test Image:
NIIS Image of Optical Fiber:
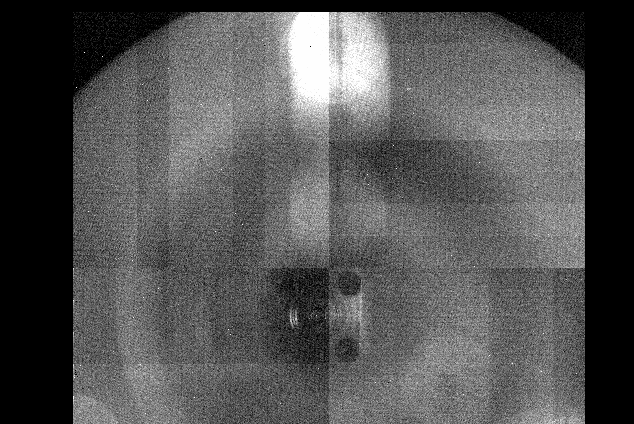 NIIS image of the 100 um optical fiber used to verify the instrument's optical
performance. The oject near the center of the field is the mount for the
optical fiber. The fiber is the small spot of light near the center.
NIIS image of the 100 um optical fiber used to verify the instrument's optical
performance. The oject near the center of the field is the mount for the
optical fiber. The fiber is the small spot of light near the center.
Radial Profile of Optical Fiber Image:
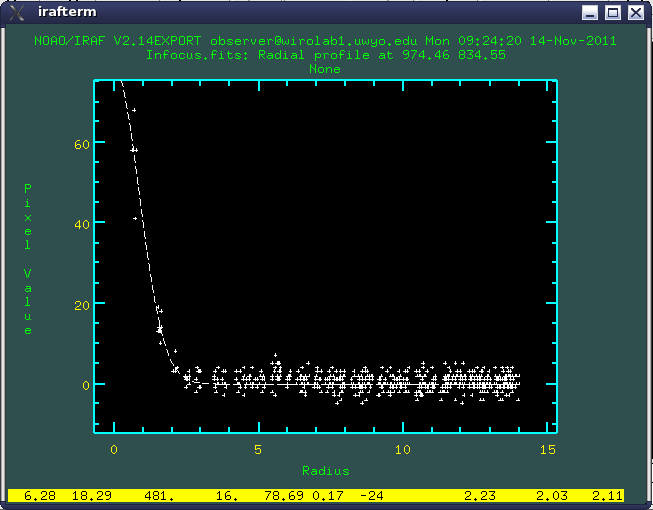 The radial profile of the image of the optical fiber. This graph shows the
distribution of intensity binned in radius from the intensity-weighted
centroid of the image. The numbers displayed at lower right are three
different methods for measuring the width of the image at half-maximum, the
so-called full-width at half-max (FWHM). The value of 2.1 pixels is very
near the theoretical limit of the 100 um fiber and corresponds to 0.58 arcsec
at the 3.5-meter APO telescope.
The radial profile of the image of the optical fiber. This graph shows the
distribution of intensity binned in radius from the intensity-weighted
centroid of the image. The numbers displayed at lower right are three
different methods for measuring the width of the image at half-maximum, the
so-called full-width at half-max (FWHM). The value of 2.1 pixels is very
near the theoretical limit of the 100 um fiber and corresponds to 0.58 arcsec
at the 3.5-meter APO telescope.